PTP1B Inhibitor Screening Assay Kit (ab139465)
Key features and details
- Assay type: Enzyme activity
- Detection method: Colorimetric
- Platform: Microplate reader
- Sample type: Inhibitor compounds, Purified protein
Overview
-
Product name
PTP1B Inhibitor Screening Assay Kit
See all PTP1B kits -
Detection method
Colorimetric -
Sample type
Purified protein, Inhibitor compounds -
Assay type
Enzyme activity -
Product overview
Abcam PTP1B Inhibitor Screening Assay Kit (ab139465) is a colorimetric, non-radioactive assay designed to measure the phosphatase activity of purified PTP1B. This 96-well assay is useful for screening inhibitors and modulators of PTP1B activity.
The kit includes human, recombinant PTP1B (residues 1-322; MW=37.4 kDa), expressed in E. coli as a positive control. The PTP1B inhibitor suramin is including as control for inhibitor detection.
The detection of free-phosphate released is based on the classic Malachite green assay and offers the advantages of convenient, one-step detection and excellent sensitivity, without radioactivity.
-
Notes
Abcam has not and does not intend to apply for the REACH Authorisation of customers’ uses of products that contain European Authorisation list (Annex XIV) substances.
It is the responsibility of our customers to check the necessity of application of REACH Authorisation, and any other relevant authorisations, for their intended uses. -
Platform
Microplate reader
Properties
-
Storage instructions
Please refer to protocols. -
Components 1 x 96 tests 96-well Clear Microplate (1/2 Volume) 1 unit Phosphate Standard 1 x 0.5ml PTP1B Assay Buffer 1 x 20ml PTP1B Enzyme (Human, Recombinant) 1 x 5µg PTP1B Inhibitor 1 x 10mg PTP1B Substrate 1 x 1mg Red Assay Reagent 1 x 5ml -
Research areas
-
Function
May play an important role in CKII- and p60c-src-induced signal transduction cascades. -
Sequence similarities
Belongs to the protein-tyrosine phosphatase family. Non-receptor class 1 subfamily.
Contains 1 tyrosine-protein phosphatase domain. -
Post-translational
modificationsOxidized on Cys-215; the Cys-SOH formed in response to redox signaling reacts with the alpha-amido of the following residue to form a 4-amino-3-isothiazolidinone serine cross-link, triggering a conformational change that inhibits substrate binding and activity. The active site can be restored by reduction. -
Cellular localization
Endoplasmic reticulum membrane. - Information by UniProt
-
Alternative names
- PTP1B
- Non receptor tyrosine phosphatase 1
- Protein phosphotyrosylphosphatase 1B
see all
Images
-
Dilutions of phosphate standard and a buffer blank were prepared. The 100 µL samples were mixed with 25 µL Red Assay Reagent and incubated at 30°C, 20 min to develop color. OD620nm was read on a microplate-reading spectrophotometer. Least-squares fit to the entire set of phosphate amounts, from 0 to 3 nmol.
-
Dilutions of phosphate standard and a buffer blank were prepared. The 100 µL samples were mixed with 25 µL Red Assay Reagent and incubated at 30°C, 20 min to develop color. OD620nm was read on a microplate-reading spectrophotometer. A more accurate correlation of OD620 to phosphate is obtained by separate fits of the data from 0 to 1 nmol and 1 to 3 nmol.
-
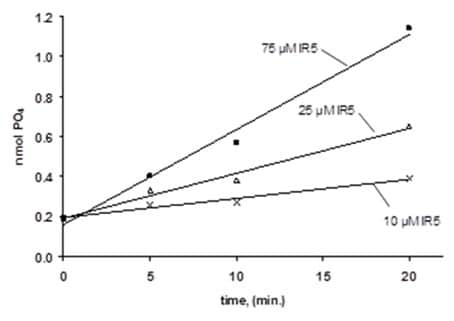
2X PTP1B Substrate solutions (150, 50 and 20 µM) and 2X PTP1B Enzyme solutions (2 ng/well) were prepared and incubations at 30°C were performed. Reactions were then terminated by addition of 25 µL of Red Assay Reagent and OD620 read. OD620 readings were converted to nmol of PO4 with a phosphate standard curve. Each point represents the mean of two determinations.
-
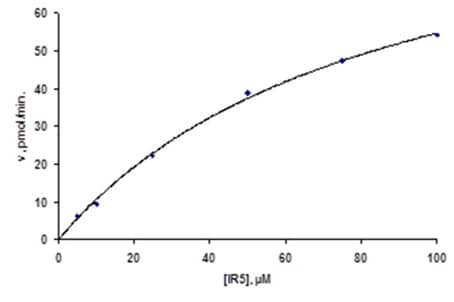
Initial rates of IR5 (PTP1B Substrate) dephosphorylation by 2 ng of PTP1B were determined at 30°C and the indicated concentrations from 20 min. Time course plots (See Fig. 2 and Data Analysis). The line is a non-linear least squares fit to the Michaelis-Menten equation. The Km for IR5 (PTP1B Substrate) was 85 µM and the Vmax was 101 pmol/min.
-
Phosphate release from 75 µM PTP1B Substrate by 2.5 ng PTP1B (30°C) was measured at 10 min. Intervals for 30 min at suramin concentrations of 0 to 100 µM. Data were converted from OD620 to pmol of phosphate by means of standard curves (see Fig. 1B) and initial rates determined from best fits to the linear parts of plots of pmol phosphate vs. time (0-20 min. for 0 and 2 µM suramin, 0-30 min. for all other concentrations). The dose-response curve was derived from a least squares fit to the 4-parameter Hill-Slope model:
(see Protocol Figure 4 legend text). The fitted parameter values were: top = 101.9 pmol/min; bottom = -3.5 pmol/min; IC50 = 9.5 µM; slope = 1.8.
-
PTP1B (2.5 ng) (red squares) or buffer (blue diamonds) was incubated for 20 minutes at 30°C with 75 µM PTP1B Substrate. Reactions were then terminated by addition of 25 µL of Red Assay Reagent and OD620 read. The Z’ factor for this assay was 0.84, (Z-factor = 1-((3SDpositive + 3SDnegative)/(mean positive – mean negative)). Dashed lines indicate the 3*Standard deviation range.


