Mouse TNF alpha ELISA Kit (ab208348)
")
Key features and details
- One-wash 90 minute protocol
- Sensitivity: 9.1 pg/ml
- Range: 46.88 pg/ml - 3000 pg/ml
- Sample type: Cell culture supernatant, Cit plasma, EDTA Plasma, Hep Plasma, Serum
- Detection method: Colorimetric
- Assay type: Sandwich (quantitative)
- Reacts with: Mouse
Overview
-
Product name
Mouse TNF alpha ELISA Kit
See all TNF alpha kits -
Detection method
Colorimetric -
Precision
Intra-assay Sample n Mean SD CV% Overall 8 6.7% Inter-assay Sample n Mean SD CV% Overall 3 9.8% -
Sample type
Cell culture supernatant, Serum, Hep Plasma, EDTA Plasma, Cit plasma -
Assay type
Sandwich (quantitative) -
Sensitivity
9.1 pg/ml -
Range
46.88 pg/ml - 3000 pg/ml -
Recovery
Sample specific recovery Sample type Average % Range Serum 97 85% - 115% Cell culture media 111 109% - 115% Hep Plasma 92 85% - 103% EDTA Plasma 99 98% - 101% Cit plasma 87 85% - 88% -
Assay time
1h 30m -
Assay duration
One step assay -
Species reactivity
Reacts with: Mouse -
Product overview
Mouse TNF alpha ELISA Kit (ab208348) is a single-wash 90 min sandwich ELISA designed for the quantitative measurement of TNF alpha protein in cell culture supernatant, serum, cit plasma, edta plasma, and hep plasma. It uses our proprietary SimpleStep ELISA® technology. Quantitate Mouse TNF alpha with 9.1 pg/ml sensitivity.
SimpleStep ELISA® technology employs capture antibodies conjugated to an affinity tag that is recognized by the monoclonal antibody used to coat our SimpleStep ELISA® plates. This approach to sandwich ELISA allows the formation of the antibody-analyte sandwich complex in a single step, significantly reducing assay time. See the SimpleStep ELISA® protocol summary in the image section for further details. Our SimpleStep ELISA® technology provides several benefits:
- Single-wash protocol reduces assay time to 90 minutes or less
- High sensitivity, specificity and reproducibility from superior antibodies
- Fully validated in biological samples
- 96-wells plate breakable into 12 x 8 wells stripsA 384-well SimpleStep ELISA® microplate (ab203359) is available to use as an alternative to the 96-well microplate provided with SimpleStep ELISA® kits.
ASSAY SPECIFICITY
This kit recognizes both native and recombinant mouse TNF alpha protein in serum, plasma, and cell culture supernatant samples only.
CROSS REACTIVITY
Recombinant mouse TNF RI, TNF RII, OPG, CD40 receptor, IL1 beta, IL-16, and IL-5 were prepared at 100 ng/mL and assayed for cross reactivity. No cross-reactivity was observed.
Recombinant human TNF alpha was prepared at 100 ng/mL, 25 ng/mL, and 3 ng/mL and assayed for cross reactivity. On average, 3.0% cross-reactivity was observed with a standard deviation of 0.7%.
INTERFERENCE
Recombinant mouse TNF RI, TNF RII, OPG, CD40 receptor, IL1 beta, IL-16, and IL-5 and recombinant human TNF alpha were prepared at 100 ng/mL and tested for interference. No interference with was observed.
SPECIES REACTIVITY
This kit recognizes mouse TNF alpha protein.
CALIBRATION
This immunoassay is calibrated against a highly purified mouse TNF alpha. The NIBSC/WHO unclassified purified mouse TNF alpha preparation 88/532 was evaluated in this kit.
The dose response curve of the unclassified standard 88/532 parallels the SimpleStep standard curve. To convert sample values obtained with the SimpleStep mouse TNF alpha kit to approximate NIBSC 88/532 units, use the equation below.
NIBSC (88/532) approximate value (units/mL) = 2.0 x SimpleStep mouse TNF alpha value (pg/mL)
-
Notes
Tumor necrosis factor, or TNF alpha, is a cytokine that binds to TNFRSF1A/TNFR1 and TNFRSF1B/TNFBR. Furthermore, TNF alpha is a ligand of the TNF superfamily which plays a central role in inflammation, apoptosis, proliferation, invasion, angiogenesis, metastasis, and morphogenesis. It is mainly secreted by macrophages, and can induce cell death of certain tumor cell lines. Rat and Human TNF alpha are 95% and 79% identical to Mouse TNF alpha, respectively.
TNF alpha is expressed on macrophages and endothelial, epithelial, and tumor cells as a 26 kDa transmembrane protein. TNF-alpha is cleaved by proteolytic processing into six chains: (1) TNF membrane form, (2) Intracellular domain 1 (ICD1), (3) Intracellular domain 2 (ICD2), (4) C-domain 1, (5) C-domain 2 and (6) TNF soluble form. ICD1 and ICD2 are released into the cytosol, while C-domain 1 and C-domain 2 are released into the extracellular space. Furthermore, the membrane form, but not the soluble form, is phosphorylated on serine residues. Dephosphorylation of the membrane form occurs by binding to soluble TNFRSF1A/TNFR1.
Signaling from TNF-alpha differs depending on the type of ligand initiating the signaling event (intracellular, membrane, or soluble). As an example, the membrane form of TNF-alpha appears to mediate anti-tumorigenic therapeutic responses whereas the soluble ligand is linked to inflammation and proliferation. Likewise, the TNF intracellular domain (ICD) form induces IL-12 production in dendritic cells.
-
Platform
Pre-coated microplate (12 x 8 well strips)
Properties
-
Storage instructions
Store at +4°C. Please refer to protocols. -
Components 1 x 96 tests 10X Mouse TNF alpha Capture Antibody 1 x 600µl 10X Mouse TNF alpha Detector Antibody 1 x 600µl 10X Wash Buffer PT (ab206977) 1 x 20ml Antibody Diluent CPI - HAMA Blocker (ab193969) 1 x 6ml Mouse TNF alpha Lyophilized Recombinant Protein 2 vials Plate Seals 1 unit Sample Diluent NBS 1 x 20ml Sample Diluent NS (ab193972) 1 x 50ml SimpleStep Pre-Coated 96-Well Microplate (ab206978) 1 unit Stop Solution 1 x 12ml TMB Development Solution 1 x 12ml -
Research areas
-
Function
Cytokine that binds to TNFRSF1A/TNFR1 and TNFRSF1B/TNFBR. It is mainly secreted by macrophages and can induce cell death of certain tumor cell lines. It is potent pyrogen causing fever by direct action or by stimulation of interleukin-1 secretion and is implicated in the induction of cachexia, Under certain conditions it can stimulate cell proliferation and induce cell differentiation. -
Involvement in disease
Genetic variations in TNF are a cause of susceptibility psoriatic arthritis (PSORAS) [MIM:607507]. PSORAS is an inflammatory, seronegative arthritis associated with psoriasis. It is a heterogeneous disorder ranging from a mild, non-destructive disease to a severe, progressive, erosive arthropathy. Five types of psoriatic arthritis have been defined: asymmetrical oligoarthritis characterized by primary involvement of the small joints of the fingers or toes; asymmetrical arthritis which involves the joints of the extremities; symmetrical polyarthritis characterized by a rheumatoidlike pattern that can involve hands, wrists, ankles, and feet; arthritis mutilans, which is a rare but deforming and destructive condition; arthritis of the sacroiliac joints and spine (psoriatic spondylitis). -
Sequence similarities
Belongs to the tumor necrosis factor family. -
Post-translational
modificationsThe soluble form derives from the membrane form by proteolytic processing.
The membrane form, but not the soluble form, is phosphorylated on serine residues. Dephosphorylation of the membrane form occurs by binding to soluble TNFRSF1A/TNFR1.
O-glycosylated; glycans contain galactose, N-acetylgalactosamine and N-acetylneuraminic acid. -
Cellular localization
Secreted and Cell membrane. - Information by UniProt
-
Alternative names
- APC1
- APC1 protein
- Cachectin
see all -
Database links
- Entrez Gene: 21926 Mouse
- SwissProt: P06804 Mouse
- Unigene: 1293 Mouse
Images
-
Other - Mouse TNF alpha ELISA Kit (ab208348)
SimpleStep ELISA technology allows the formation of the antibody-antigen complex in one single step, reducing assay time to 90 minutes. Add samples or standards and antibody mix to wells all at once, incubate, wash, and add your final substrate. See protocol for a detailed step-by-step guide.
-
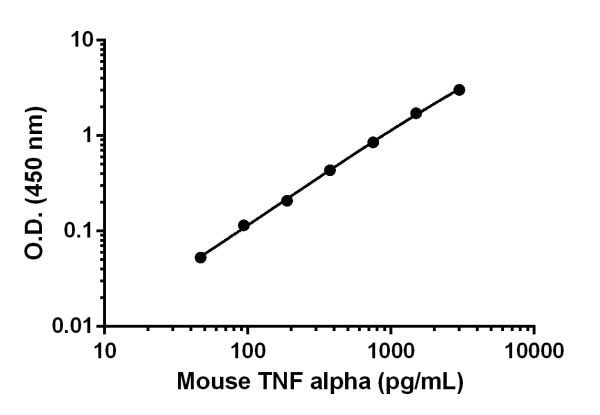
 Example of mouse TNF alpha standard curve in Sample Diluent 25BS
Background-subtracted data values (mean +/- SD) are graphed.
-
 Example of mouse TNF alpha standard curve in Sample Diluent 25BS.
The TNF alpha standard curve was prepared as described. Raw data values are shown in the table. Background-subtracted data values (mean +/- SD) are graphed.
-
 Example of mouse TNF alpha standard curve in Sample Diluent 10BS
Background-subtracted data values (mean +/- SD) are graphed.
-
 Example of mouse TNF alpha standard curve in Sample Diluent 10BS.
The TNF alpha standard curve was prepared as described. Raw data values are shown in the table. Background-subtracted data values (mean +/- SD) are graphed.
-
 Example of mouse TNF alpha standard curve in Sample Diluent NS
Background-subtracted data values (mean +/- SD) are graphed.
-
 Example of mouse TNF alpha standard curve in Sample Diluent NS.
The TNF alpha standard curve was prepared as described. Raw data values are shown in the table. Background-subtracted data values (mean +/- SD) are graphed.
-
 Interpolated concentrations of spiked TNF alpha in mouse plasma samples
The concentrations of TNF alpha were measured in duplicates, interpolated from the TNF alpha standard curves and corrected for sample dilution. Undiluted samples are as follows: plasma (citrate) 100%, plasma (EDTA) 100%, and plasma (heparin) 100%. The interpolated dilution factor corrected values are plotted (mean +/- SD, n=2). The mean TNF alpha concentration was determined to be 1.68 ng/mL in plasma (citrate), 1.81 ng/mL in plasma (EDTA) and 1.47 ng/mL in plasma (heparin).
-
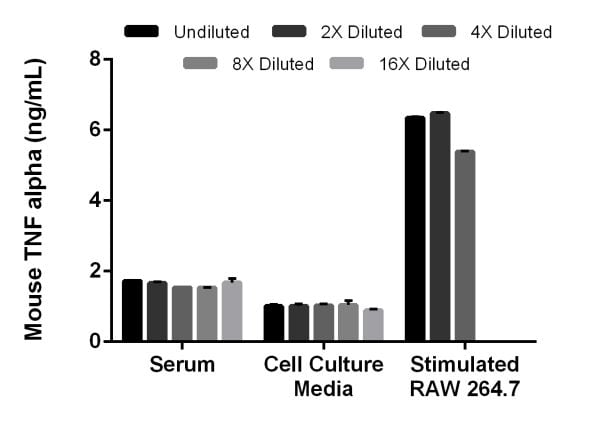 Interpolated concentrations of spiked mouse TNF alpha in mouse serum and cell culture samples and native mouse TNF alpha in mouse RAW 264.7 LPS stimulated cell culture supernatants
The concentrations of TNF alpha were measured in duplicates, interpolated from the TNF alpha standard curves and corrected for sample dilution. Undiluted samples are as follows: serum 100%, cell culture 100%, and RAW 264.7 LPS stimulated cell culture supernatants 50%. The interpolated dilution factor corrected values are plotted (mean +/- SD, n=2). The mean TNF alpha concentration was determined to be 1.63 ng/mL in serum, 1.00 ng/mL in cell culture and 6.07 ng/mL in RAW 264.7 LPS stimulated cell culture supernatants.
-
 Interpolated concentrations of native TNF alpha in mouse RAW 264.7 LPS stimulated and unstimulated cell culture supernatant samples
The concentrations of TNF alpha were measured in duplicates, interpolated from the TNF alpha standard curves and corrected for sample dilution. Undiluted samples are as follows: RAW 264.7 LPS stimulated supernatant 50% and RAW 264.7 LPS unstimulated supernatant 50%. The interpolated dilution factor corrected values are plotted (mean +/- SD, n=2). The mean TNF alpha concentration was determined to be 6346.4 pg/mL in RAW 264.7 LPS stimulated supernatant and 83.7 pg/mL in RAW 264.7 LPS unstimulated supernatant. RAW 264.7 cells were cultured in HGDMEM with 100 μg/mL Kanamycin and 2 mM L-glutamine. Cells were starved for 24 hours and treated in the presence and absence of 5 μg/mL of LPS.
-
 Assay sensitivity
The calculated minimal detectable dose (MDD) is determined by calculating the mean of zero standard replicates and adding 2 standard deviations then extrapolating the corresponding concentrations. The MDD is dependent on the Sample Diluent buffer used.
-
 Sandwich ELISA - Mouse TNF alpha ELISA Kit (ab208348)To learn more about the advantages of recombinant antibodies see here.


